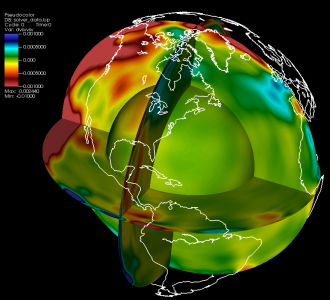
Researchers led by Jeroen Tromp are using Titan to map the speeds of waves generated after earthquakes. This process, known as seismic tomography, provides the team with unprecedented temperature and composition (type of rock) estimates for the Earth’s interior.
Researchers turn to Titan to construct better image of mantle
When it comes to the Earth’s interior, researchers have only “scratched the surface.” Our idea of what the deep Earth looks like is largely inferred from surface observations; unfortunately, what goes on beneath our feet has serious catastrophic potential. Earthquakes, volcanoes, and other general geological maladies begin beneath the surface, in a world we know very little about.
To better understand our planet and better prepare for tomorrow’s calamities, researchers need a more detailed picture of our Earth’s anatomy, specifically the mantle. This means imaging about halfway down to the Earth’s center. “The outer part [of the Earth] is the exciting part,” said Jeroen Tromp of Princeton University.
Tromp is part of a team using the Titan supercomputer, located at the Department of Energy’s Oak Ridge National Laboratory (ORNL), to reveal the Earth’s inner workings via adjoint tomography simulations, or monitoring the interaction of a forward wavefield, in which the waves travel from the source to the receivers, and an “adjoint” wavefield in which the waves travel inversely from the receivers to the source. “We want to image the physical state of the Earth’s interior,” he said.
The good news is that we largely know how the Earth underneath our feet operates. Convection carries the cooler, upper area of the Earth’s mantle downward while bringing the warm material closer to the core upward, the process behind plate tectonics.
Specifically, the East Pacific Rise, a tectonic plate boundary in the Pacific Ocean extending from Antarctica to the Gulf of California, and the Atlantic Ridge, another boundary extending from the Southern Atlantic through Iceland, are where the warmer material surfaces and where the majority of Earth’s volcanic activity takes place.
However, as these plates cool and spread apart, they are pushed back into the mantle (or subducted), and the warm material causes fluids to “boil off.”
Furthermore, this interaction between plates creates earthquakes, or seismic waves generated by a release of energy in the Earth’s crust. It is from these earthquakes that Tromp receives the data necessary to image the Earth’s interior.
So far the team has successfully mapped the earth under Southern California up to 40 kilometers and beneath Europe to 700 kilometers. With Titan, however, the team hopes to map the entire globe to a depth of 2,900 kilometers, far and away the most ambitious effort of its kind. This revolutionary imaging should give researchers a much better idea of the physics and chemistry of the Earth halfway down to the core, that is, to the core-mantle boundary.
And they are well on their way. Tromp’s team has doubled the speed of its SPECFEM3D_GLOBE application to better take advantage of Titan’s GPU-assisted hybrid architecture, and with the help of the Oak Ridge Leadership Computing Facility’s (OLCF’s) data science liaisons, the code’s integrated data workflow is likewise rapidly improving. The OLCF is a DOE Office of Science User Facility.
Catching a wave
Earthquakes generate seismic waves that ripple through the Earth’s layers at various speeds. Much as medical tomography uses waves to image sections of the human body, seismic imaging uses waves generated by earthquakes to reveal the structure of the Earth. Depending on the properties of a given material, differing wave speeds reveal its temperature and chemical composition. In other words, by mapping the speeds of waves generated after earthquakes, Tromp’s team can arrive at better temperature and composition (type of rock) estimates for the Earth’s interior, a process known as seismic tomography.
Tromp’s team receives its data from the National Science Foundation (NSF)-funded Incorporated Research Institutions for Seismology, or IRIS, a consortium of more than 100 US universities dedicated to the operation of science facilities for the acquisition, management, and distribution of seismological data. The team seeks out earthquakes that register greater than 5.5 on the Richter scale. (So far it has analyzed 255, but it ultimately hopes to harness more than 6,000 5.5–7.2 magnitude quakes).
Individual earthquakes are typically recorded by several thousand seismographic instruments, each recording three-component data with time series typically 2 hours long. That data is then used to compute the earthquake source, and then simulate seismic wave propagation in three dimensions from each source, and the resulting “synthetic seismograms” are compared to observed data. The differences between the synthetic and observed seismograms help the team improve its models for the Earth’s mantle, said Tromp.
This approach differs from that of past research in that those efforts used arrival-time information of only two easily-identifiable types of seismic waves: basic sound and shear waves. Whereas in the past researchers simply mapped variations in shear and sound wave speeds by measuring variations in arrival times, now, with the help of Titan, they can achieve full three-dimensional (3D) simulations of complete seismograms, an approach known as “full waveform inversion.” This approach leads to more accurate models because of the increased amount of data used from the seismograms, said Tromp.
“The number of calculations involved in doing these operations is so overwhelming it can only be done on systems like Titan,” he added.
Partners in science
While the team’s research won’t actually predict earthquakes, it will give the team a better idea of what might happen when one occurs. For instance, what types of waves will hit where and what areas around a fault line are most vulnerable to damage? This type of information is extremely important to city planners and structural engineers in metropolitan areas aligned with fault zones, such as Los Angeles.
It’s also critical to the Southern California Earthquake Center (SCEC), a community of more than 600 scientists, students, and others at more than 60 institutions worldwide headquartered at the University of Southern California. SCEC is funded by NSF and the US Geological Survey to develop a comprehensive understanding of earthquakes in Southern California and elsewhere and to communicate useful knowledge for reducing earthquake risk. The center separately uses Titan to achieve some of the largest earthquake simulations in the world.
SCEC’s physics-based model simulates wave propagations and ground motions radiating from the San Andreas Fault through a 3D model approximating the Earth’s crust. Essentially the simulations unleash the laws of physics on the region’s specific geological features to improve predictive accuracy.
“Adjoint tomography workflows are very challenging because they involve vast data assimilation,” said Tromp. Challenging, sure, but well worth it if it helps to mitigate the damage from the next “Big One,” particularly if you live in Southern California or another fault-heavy zone.
A helping hand
Thankfully, there is a lot more to the OLCF than Titan. The center is equipped with a staff of experts to help users with everything from porting their codes to Titan’s hybrid architecture to data analysis and visualization to enhanced I/O. For Tromp, Titan was only part of the picture.
Tromp’s team is made up of domain scientists, ones who are grounded in their specialty: in this case the Earth and its inner workings. Their familiarity with software development and computer science, however, was short of what was needed to harness the power of Titan.
To get up and running, the team made a preliminary trip to the OLCF in December 2012 and visited with Judy Hill, a liaison in the Scientific Computing Group at the center. Hill helped the group compile its SPECFEM3D_GLOBE spectral element wave propagation code and took the researchers through the basics of running on Titan. Now the group’s workflow is up to par with that of other Titan users, running large-scale simulations that scale well to Titan’s enormous architecture. In fact, the team is now running simultaneous “ensemble” simulations that will further improve its model of the Earth beneath our feet. “Now we’re trying to automate the workflow and data analysis,” said Hill.
That, too, is the realm of the Scientific Computing Group.
“The amount of I/O here is phenomenal,” said Tromp, adding that in traditional seismology, every seismogram is one file, and each earthquake involves thousands of seismograms, with the team eventually studying thousands of earthquakes. The sheer number of files could hurt Titan’s file system, one of the world’s biggest.
“The main bottlenecks in the adjoint tomography workflow stem from the number of files to be read and written, which significantly reduces performance and creates problems on large-scale parallel file systems due to heavy I/O traffic,” said the OLCF’s Norbert Podhorszki, adding that classical seismic data formats, which describe each seismic trace as a single file, exacerbate this problem.
Enter ADIOS, a parallel I/O library that provides a simple, flexible way for scientists to describe the data in their code that may need to be written, read, or processed outside of the running simulation. The middleware, developed at ORNL with partners from academia, was chosen to create a new data format for this project to aggregate a large amount of information into large files and improve the I/O performance of the workflow.
The team’s SPECFEM3D_GLOBE simulation now uses ADIOS to write its output for checkpointing and visualization. Furthermore, the OLCF has developed a parallel data reader for SPECFEM3D_GLOBE simulation output that is being used inside VisIt, a free interactive parallel visualization and graphical analysis tool for viewing scientific data on Unix and PC platforms. In it each ADIOS file contains data about the three layers of the Earth that are being simulated (crust-mantle, outer core, and inner core).
Using the new ADIOS data reader, the OLCF has produced visualizations of these recent simulation runs, giving Tromp’s team yet another major advantage in its quest to find out exactly what goes on in the planet’s underworld.
Even with systems as powerful as Titan, however, there are still limitations. For instance, Tromp would love to increase the frequency of the waves being simulated. While his team is currently resolving waves with periods of 9 seconds—or the time it takes particles to move up and down—the researchers would like to reach a period of 1 second, the shortest-period waves, which can travel clear across our planet. “The good news is that data are available for those shorter periods,” said Tromp, “and we have things to work toward, but they require gradual improvements in our modeling.”
With its recent work on Titan, it seems the team is well on its way.
The Oak Ridge National Laboratory is supported by the Office of Science of the U.S. Department of Energy. The Office of Science is the single largest supporter of basic research in the physical sciences in the United States, and is working to address some of the most pressing challenges of our time. For more information, please visit science.energy.gov


