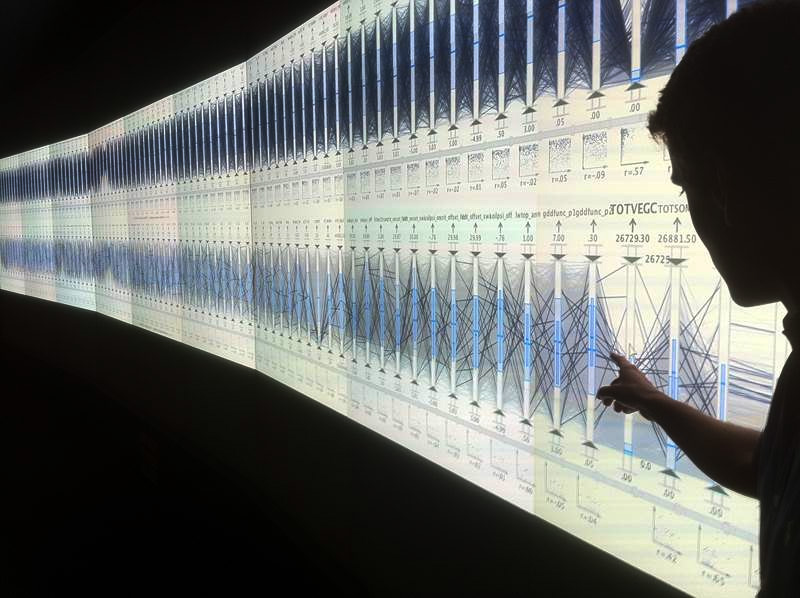
A parallel coordinate visualization. Each view is showing 88 variables from Community Land Model ensemble runs for a grand total of 176 variables over 1,000 ensemble runs, a feat only possible on a high resolution display like EVEREST.
Computational scientists need all the help they can get. The amount of data generated by today’s high-performance computing systems is enormous and growing proportionally with the size and capability of the most recent hardware. To quickly and easily make sense of that much information, visualization and data analysis tools are critical.
When the Oak Ridge Leadership Computing Facility (OLCF) upgraded its Jaguar supercomputer to the Cray XK7 CPU/GPU hybrid system known as Titan, the center knew that upgrades to its data analysis and visualization resources were necessary to complement Titan’s more than 20 petaflops of computing power.
The result is a world-class visualization facility that allows researchers to view their data interactively and simply, without the help of the OLCF’s visualization liaisons, who focus on very large datasets and high-end rendering.
When the OLCF set out to upgrade its visualization facility, it did so with the researcher in mind. In fact, the entire system is the result of conversations with the user community aimed at providing the best system possible for the vast spectrum of researchers and specialties that use OLCF resources such as Titan.
After extensive investigation into the users’ needs—literally meeting with representatives from all of the OLCF’s scientific domains—visualization staff set about creating one of the world’s premier scientific visualization facilities, a working laboratory that will allow researchers to analyze and decipher their data as efficiently as possible.
Despite the diverse and numerous requirements of the center’s user community, the OLCF quickly realized that several key qualities were critical to pleasing the user base as a whole. Five, in particular, stood out: interactivity for complex data, binocular depth perception, ease of use, ultrahigh resolution, and fast I/O performance.
To gauge the new laboratory’s effectiveness, the OLCF opened the experimental system to a set of early users. The results were promising, to say the least.
A user-first philosophy
A team led by Jeremy Smith of the University of Tennessee and Oak Ridge National Laboratory (ORNL) focuses on boosting biofuels production by understanding the basic science of biomass’s resistance to breakdown (i.e., recalcitrance). The team performs molecular dynamics simulations that are inherently three-dimensional (3D), spatially complex, and changing in time. The large physical size of the laboratory allowed numerous members of Smith’s team to interactively explore this time series data in 3D, leading to insight and increased scientific understanding.
“Often important insights from the simulation can be obtained by first looking at the trajectory and identifying processes in the simulation that appear interesting and then following up with data-intensive analysis,” said team member Loukas Petridis. “Visualizing a simulation on one’s desktop is simply not possible due to the large size of the system and its memory requirements. We therefore rely on the OLCF’s visualization facility to perform this first step in scientific discovery.”
The flexibility of the visualization laboratory’s new design allowed the researchers to use tools developed within the OLCF to interactively move around within the data and identify features of interest, which then guided them to further simulations to be run.
In particular, Smith’s team used a custom interactive OpenGL renderer created by the OLCF’s Mike Matheson, allowing the team to manipulate the simulation data it had calculated on Titan. Previously the team had relied on animations and watched them as one would a movie—as a passive viewer. While this approach is useful, it doesn’t allow researchers to interact with the data and look at different features, zoom in and out, or change the mapping of the data. The new tool has features that behave more like a video game than a movie, with fast updates and interactive capabilities, said Matheson.
And that’s not the only difference. Smith’s team also took advantage of stereo visualization to add an additional cue for interpretation. The human visual system is accustomed to interpreting the world around it using two eyes, which communicates depth information to our brain. Similarly, when Smith’s team is using stereo to view simulation data, it also receives depth information, allowing the researchers to interpret the data more intuitively by determining spatial relationships in a previously unavailable manner.
Michael Brown, along with postdoctoral fellows Jan-Michael Carrillo and Trung Nguyen, likewise uses Titan to tackle a complex energy-science problem: the simulation of organic photovoltaic (OPV) materials and the rupture mechanism of liquid crystal thin films, particularly the formation of interfaces within polymer-blend active layers critical to the performance of OPV solar cells. OPVs are a promising source of renewable energy by virtue of their low cost, high flexibility, and light weight, and on Titan the formation of these materials has been simulated at the most realistic scale ever achieved.
The ability of liquid crystal (LC) molecules to respond to changes in their environment makes them an interesting candidate for thin film applications, particularly in bio-sensing and bio-mimicking devices, and optics. Yet understanding of the (in)stability of this family of thin films has been limited by the inherent challenges encountered by experiment and continuum models. Using unprecedented, large-scale molecular dynamics simulations, the researchers address the rupture origin of LC thin films wetting a solid substrate at length scales similar to those in experiment.
Brown’s team made extensive use of the new visualization laboratory, which became a key component of its scientific workflow, by exploring simulation data in 3D, work that led to publications in Physical Chemistry Chemical Physics and Nanoscale. The team also benefitted from the laboratory’s increased I/O performance, as have other research teams, particularly ORNL’s astrophysics group, which studies one of the great unsolved mysteries in astrophysics: the explosion of core-collapse supernovas.
Another early success story is Peter Thornton’s INCITE climate project. The team used the EDEN (Exploratory Data analysis ENvironment) software package, created by ORNL’s Chad Steed, on the new laboratory’s full-resolution shared-memory node, work that would have taken far too much time on standard visualization clusters. Thornton’s datasets contain 88 variables, and the new visualization facility’s high-resolution capability allowed the team to explore parallel coordinates and scatter plot all the 88-variable datasets for the first time. “Without high resolution, this type of work cannot be done,” said OLCF staff member Jamison Daniel.
“The combination of the EDEN visualization software and the high-resolution display provided a unique and valuable view into our research results,” said Thornton. “We are planning new analyses using this approach.”
Whatever the science, said Daniel, one thing is key: ease of use. This user-first philosophy is the main reason OLCF staff went to the center’s user base for input instead of simply building a visualization lab with a fixed design (as is often the case) and then offering it to users. The user-first philosophy is clearly paying off.
The new system was officially “accepted,” or put through a series of benchmark tests to confirm its functionality, performance, and stability, at the very end of fiscal year 2013. Because early users are already successfully taking advantage of the new capabilities, the potential for real scientific breakthroughs via visualization and data analysis seems greater than ever. “These resources are necessary for achieving the center’s scientific mission,” said Daniel, adding that a new immersive tracking technology is now installed that will allow users to follow, in 3D, their simulations in real time.
The new ARTTRACK 3 tracking system, developed to work in a fashion similar to that of the human visual system, will allow interactivity with large datasets using Titan and Rhea, the OLCF’s new visualization and analysis cluster. Datasets generated on Titan are so large they cannot be analyzed or visualized on a single workstation as they were in the past; the work must be distributed across several systems. The new visualization lab serves as the front end for observation and analysis as simulations unfold. The OLCF visualization team has worked with Kitware, Inc. to deploy this technology in both the new lab and the Center for the Advanced Simulation of Light Water Reactorsg, likewise located at ORNL.
Finally, the OLCF visualization team has worked closely with GPU-maker NVIDIA on driver support, deploying the highest-ever resolution on a single node and enabling Thornton’s team to visualize the 88-variable parallel coordinate work. This capability allows a researcher to drive the entire resolution of each wall from a single shared-memory system, so there is no need to distribute the graphics across a cluster of machines. The OLCF was the first center to deploy a shared-memory node that drives at this resolution.
With this revolutionary visualization capability, Titan has the perfect partner in world-leading scientific simulation. Data is only as good as our ability to understand it, and now that understanding can be visually obtained faster and more accurately than ever before.