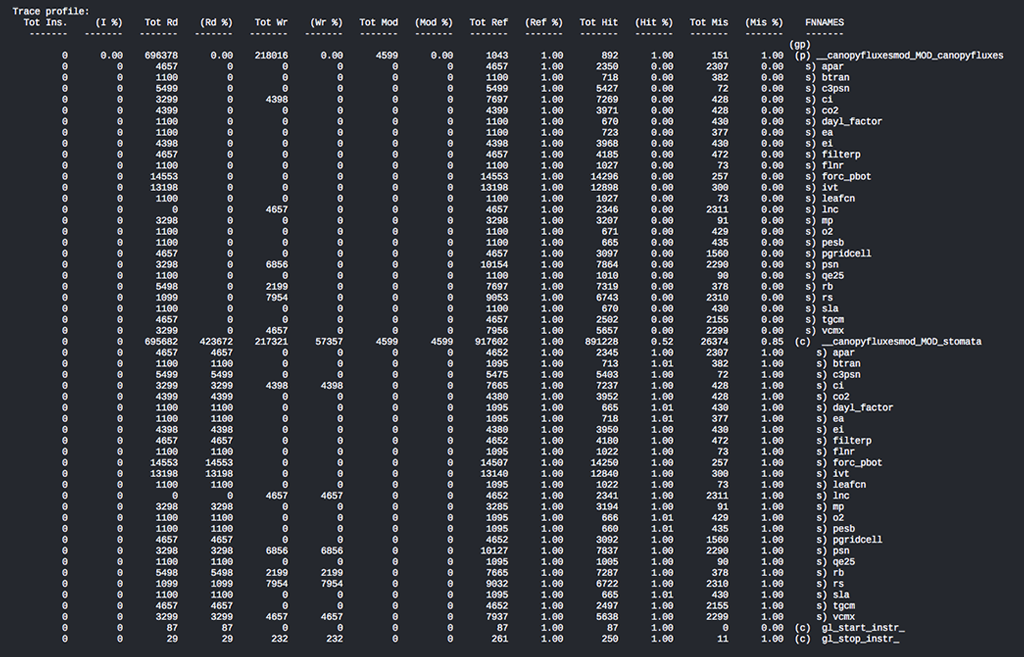
GLprof’soutput is a flat-profile indicating which data structures are responsible for the overall cache behavior within certain subroutines. This example shows each data structure under the subroutine_canopyfluxesmod_MOD_ experiencing cache misses. In this instance a user would need to address data-structures such as: vcmx, tgcm, lnc, apar, etc., in order to optimize their code’s memory behavior. This figure was taken from a sample trace-file, and is intended for illustration purposes only.
OLCF support staff delivers new smart tool for processing memory transaction traces
Cache memory might not mean much to laptop and smart phone users, but in the realm of high-performance computing—where time and energy consumption can equate to large dollar amounts—managing cache behavior becomes exponentially essential.
But fortunately for the supercomputer Titan and its users at the Oak Ridge Leadership Computing Facility (OLCF)—a US Department of Energy Office of Science User Facility—managing cache behavior has gotten a little easier thanks to the newly developed tool GLprof. Simply put, GLprof is a simulation tool used to analyze memory transaction traces and their effect on an application’s memory subsystems (i.e., cache memory).
“A trace file is basically a collection of events or a collection of reads and writes to and from memory. And because these traces can be many gigabytes—sometimes terabytes—in size, we need a mechanism to process them,” said OLCF postdoctoral researcher Tomislav (Tommy) Janjusic. “In many cases, cache behavior can affect an application’s performance. So the way in which you structure the memory portion of your code will determine how the cache behaves, and in turn, will determine its effects on an application’s performance.”
There are many cache simulating tools out there, Janjusic continued. Typically, most tools provide a code-centric view, meaning users have to look at their code line by line to find where the performance bottlenecks are occurring in the data structure.
“What makes GLprof different from the rest is that it offers a data-centric view. It breaks down cache behavior in a very visual, intuitive way to understand,” Janjusic said. “So instead of code lines, it presents the actual memory, the data structure itself. That allows a user to look and say, ‘OK, this data structure causes a lot of [cache] misses, so if I want to make any changes to the code, I should probably target this specific data structure.’”
GLprof was modeled after the immensely popular profiling tool Gprof, said co-developer Christos Kartsaklis, a research associate in the OLCF’s Computer Science Research Group. Gprof, he explained, is the de facto profiling tool that has been in development for years, since the very early days of Unix operating systems; it tells users exactly which parts of code their applications are spending time on the machine and how much.
“So the idea for GLprof is that we wanted to do something similar, but just for information that concerns the memory subsystems of our machines,” Kartsaklis said. “It gives us a breakdown of which parts of the application are responsible for costs related to the cache, and that’s important because these operations are incredibly expensive in terms of performance.”
GLprof is built upon another tool, Gleipnir. A fined-grained data-centric tool, built by Janjusic during his PhD research at the University of North Texas, Gleipnir is a Valgrind plug-in that aids simulators by studying and analyzing data structure elements, making it easier to understand the memory behavior of applications. Valgrind is a binary instrumentation framework widely used for detecting memory leaks, memory debugging, and profiling.
“When Tommy joined the lab, we started using his tool with OLCF applications to better understand how they behaved,” Kartsaklis said. “We soon realized this tool could be the new standard for aggregating and presenting information in a more user friendly way.”
Gleipnir—like Valgrind, also known as the gateway to Valhalla—derives its name from Norse mythology.
“According to legend, Gleipnir is a thin ribbon, stronger than iron chains, created to restrain Fenrir, the giant wolf obsessed with devouring Odin,” Janjusic explained. “The idea is we’re using Gleipnir and these fine grain memory traces to restrain memory hogs in applications. So on the whole, we use Valgrind as the framework. On top of that is the Gleipnir plug-in to capture the trace files, and then comes GLprof to processes the traces.”
Since its development, GLprof has proved useful to many users—not just Titan users. Because GLprof is a simulation tool, it allows users to experiment with systems of various architectures to see how their application will perform on that system before doing actual production runs. Furthermore, it’s already helping pave the way for Summit, the OLCF’s next supercomputer.
“Even though we don’t know the specifics yet, we can look at what is known and build a simulator that reflects the properties in that system and run profiling simulations to prepare the codes to run efficiently when Summit arrives,” Kartsaklis said. “We’re continuing to make memory-centered tools that help users understand their applications. Our ultimate goal is to reduce the number of tools to make it easier for the users, and so far, GLprof is an excellent example of that goal.”
Oak Ridge National Laboratory is supported by the US Department of Energy’s Office of Science. The single largest supporter of basic research in the physical sciences in the United States, the Office of Science is working to address some of the most pressing challenges of our time. For more information, please visit science.energy.gov.