Researchers use an ORNL supercomputer to pinpoint process behind last deglaciation
While much is made of today’s melting Arctic ice cap, the phenomenon is not a new one.

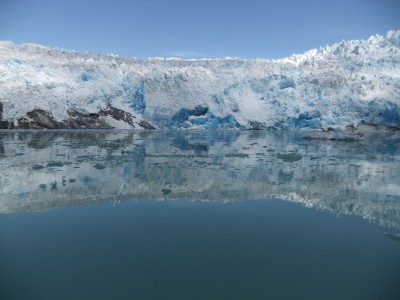
A meltwater pond in southwest Greenland. Thousands of years ago meltwater slowed ocean circulation to the point that it led to a gradual warming and deglaciation of the Southern Hemisphere.
In fact, about 22,000 years ago the Earth’s great ice sheets began to decline, slowly at first, but gradually more rapidly. Given the growing concerns about today’s shrinking glaciers and polar ice caps, scientists are very interested in knowing what happened the last time the Earth shed much of its ice. A better understanding of natural climate change should greatly assist in advancing our understanding of man-made climate change.
Researchers agree that a rapid, natural release of CO2 about 17,000 years ago led to a rise in global temperatures which further encouraged deglaciation in both the Northern and Southern Hemispheres, though at very different rates. What started the ball rolling 22,000 years ago, however, was until recently still a mystery.
Now researchers from the University of Wisconsin-Madison (UW-Madison), Harvard University, Oregon State University, and the National Center for Atmospheric Research (NCAR) have discovered the trigger for the beginning of the last great deglaciation. The team ran transient, or continuous, simulations on Oak Ridge National Laboratory’s (ORNL) Jaguar supercomputer over three years to create the first physics-based test of hemispheric deglaciation. Their culprit: a combination of increase in insolation (solar radiation that reaches the earth’s surface) caused by changes in the Earth’s orbit, and ocean circulation.
The simulations, conducted by Feng He and Zhengyu Liu of UW-Madison and Bette Otto-Bliesner of NCAR, help to recreate the climate during the first half of the last deglaciation period and identify why temperatures and deglaciation rates differed between the hemispheres. The research builds on earlier simulations performed at ORNL and featured in Science in 2009 and Nature in 2012. Their latest finding detailing ocean circulation as the primary cause of early deglacial warming in the Southern Hemisphere appears in the February 7 issue of Nature.
The research is part of a larger initiative that has succeeded in obtaining a mean global temperature for the past 21,000 years, giving scientists a much-needed tool with which to compare carbon dioxide levels and temperatures across the world. Jaguar, managed by the Oak Ridge Leadership Computing Facility (OLCF), has since transitioned to Titan, which is currently recognized as the fastest computer in the world. And results from the simulations are shedding much-needed light on our current climate conundrum.
And quite possibly our past. The team also believes that this same mechanism may apply to all of the major deglaciations for the last 450,000 years.
Two Poles, One current
The Milankovitch theory states that the Earth’s orbit around the sun is responsible for the growth and deterioration of glaciers because it changes insolation reaching and warming a given area. Starting about 21,000 years ago changes in the orbit of the Earth produced a warming of the summers in the Northern Hemisphere, leading to a general planet-wide warming.
Geologic data show that about 19,000 years ago, Northern Hemisphere glaciers began to melt, and sea levels rose. Melting glaciers dumped so much freshwater into the ocean that it slowed a system of currents known as the Atlantic meridional overturning circulation (AMOC) that transports heat throughout the world. This ocean conveyor belt is particularly important in the Atlantic where it flows northward across the equator, stealing Southern Hemisphere heat and exporting it to the Northern Hemisphere. The AMOC then sinks in the North Atlantic and returns southward in the deep ocean. A large pulse of glacial meltwater, however, can place a freshwater lid over the North Atlantic and halt this sinking, backing up the entire conveyor belt.
The team’s simulations showed a weakening of the AMOC due to the increase in glacial melt beginning about 19,000 years ago, which decreased ocean heat transport, keeping heat in the Southern Hemisphere and cooling the Northern Hemisphere. Essentially, when the AMOC broke down, the south heated up as the north cooled down, a phenomenon known to climatologists as “the bipolar seesaw.”
This, in turn, led to an enormous release of CO2 from primarily beneath the ocean, which then greatly accelerated the warming of the globe and, by extension, deglaciation. “When CO2 came out, everything changed,” said He, referring to the uncertain events preceding rising CO2 levels as the “Holy Grail of glacial theory.”
Essentially, said He, the timeline for the Earth’s last deglaciation is as follows: from 22,000 to 19,000 years ago, Northern Hemisphere insolation triggered its gradual warming as a result of the large increase in high-latitude spring–summer insolation and strong sensitivity of the land-dominated northern high latitudes to insolation forcing; from 19,000 to 17,000 years ago the AMOC phenomenon described in the team’s latest paper primarily accounts for early Southern Hemisphere warming and deglaciation; and the rise in CO2 starting around 17,000 years ago brought about the final, most drastic stages.
A little help goes a long way
To date the simulations have consumed more than 14 million processor hours on Jaguar. The Innovative and Novel Computational Impact on Theory and Experiment program, jointly managed by leadership computing facilities at Argonne and Oak Ridge National Laboratories, awarded the allocations.
The team’s weapon of choice in deciphering the climate of the last 20,000-plus years: the Community Climate System Model, a climate model that includes fully coupled atmospheric, land, ocean, and sea ice component models. The CCSM, first introduced in 1996, has as its origin the Community Climate Model, created by NCAR in 1983 as a freely available global atmospheric model for use by the wider climate research community.
Since then CCSM has evolved into the world’s leading tool for climate simulation, regularly contributing to the United Nations’ Intergovernmental Panel on Climate Change reports. “The simulation reproduces the Southern Hemisphere proxy records beautifully. A good model is the result of many people’s efforts,” said He.
The OLCF has given the project nearly 4 continuous years of access, allowing the team to run climate simulations over 22,000 years and produce nearly 300 terabytes of data. “We have the resources to stage all data online for analysis,” said the OLCF’s Valentine Anantharaj, who worked with the team to make sure they got the most from their time on Jaguar. Anantharaj now works with users on the ten-fold more powerful Titan system, and according to him the OLCF represents a valuable end-to-end resource capability: “Our facility supports a scientific workflow that enables our users to run their simulations, do their analyses, and visualize and archive the results.”
The combination of a talented team of researchers, a refined CCSM climate model, and a center with the expertise and capabilities of the OLCF is beginning to leave it’s footprint across thousands of years, from the beginning of the last deglaciation 22,000 years ago to our decisions today that will affect our climate future for years to come.
The OLCF has previously highlighted the team’s research related to the 2009 Science paper and the 2012 Nature paper


