Scientists predict disaster with models, high-performance computing, and perfect storms

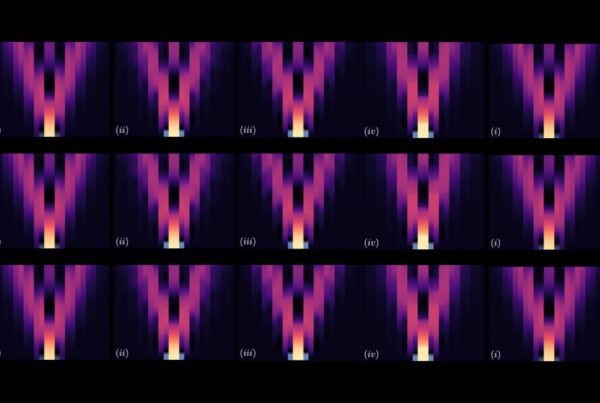
Two Hurricane Rita simulations use different numerical methods. The Reisner group’s HIGRAD code can simulate both liquid and solid elements in either a Lagrangian framework (right panel) using a particle-in-cell approach or the more typical Eulerian cloud modeling approach (left panel). Differences between the two approaches are the result of numerical errors produced by the Eulerian cloud model due to its inability to accurately resolve the movement of sharp cloud boundaries such as those occurring near the hurricane eye wall. Image courtesy of Jon Reisner, Los Alamos National Laboratory
In 2005 a tropical depression formed over the Bahamas on August 23 and intensified to a storm—Katrina—on August 24. Growing to a Category 1 hurricane, Katrina crossed southern Florida on August 25 and weakened over land. Strengthening rapidly over the Gulf of Mexico, however, she grew from Category 3 to 5, with winds in excess of 175 miles per hour, in just 9 hours. Katrina made her second landfall, in Louisiana on August 29, as a Category 3 hurricane with 111 to 130 mile per hour winds. Ultimately, the storm and subsequent floods took a confirmed 1,836 human lives in seven states and displaced more than a million people.
The complex processes of hurricane development are not readily understood or easily studied. That makes predicting the progression of a storm difficult. Now, information from major hurricanes of the last two decades such as Katrina is being put to good use by scientists striving to understand how hurricanes intensify. A research team led by Jon Reisner of Los Alamos National Laboratory (LANL) is employing the Oak Ridge Leadership Computing Facility’s (OLCF’s) Jaguar supercomputer to use data from lightning detectors and even wind instruments mounted on planes flown into the eye of a hurricane to improve atmospheric models. These simulations may lead to more accurate prediction of hurricane intensities and better preparation of the public for these inevitable disasters.
“Right now we have very little predictability in terms of the intensification of a hurricane,” Reisner said. “We can predict the track but not the intensification rate. And obviously that’s a worrisome scenario because if you have a tropical storm off Miami and then tomorrow it’s a Category 5 hurricane and the models missed it, you have problems.”
Cutting a disaster down to size
Like other natural processes, hurricane formation requires fuel. Tropical storms start at sea, gathering their energy from the heat released when oceanic water vapor condenses to liquid form. This water carries heat along with it upon vaporization. During condensation this inherent heat builds as water particles in the vapor collide and condense and ultimately gravitate toward what will become the hurricane’s eye wall, resulting in heat convection that fuels the storm.
One challenge for hurricane models has been to successfully integrate the extremely small spatial scales of this condensation process, Reisner said. The particles interact at spatial scales between 10 and 100 nanometers, ranging from the minute size of individual genes and simple viruses to the largest particle size that can slip through a surgical mask.
Reisner’s team is using a modeling and simulation software developed at LANL called HIGRAD to simulate and track individual liquid or solid particles in either a Lagrangian or Eulerian framework. Simply put, a Lagrangian frame of reference follows an individual fluid parcel as it moves through space and time, whereas a Eulerian framework focuses on a specific location in which the fluid flows over time. The Lagrangian frame of reference allows HIGRAD to look at individual water particles, permitting a more realistic representation of cloud structure within hurricanes.
The virtual particles include those the hurricane has absorbed from the condensation process. These particles can grow, collide, melt, freeze, or otherwise undergo any action or interaction, any microphysical process that occurs in an actual hurricane on this minute spatial scale. In total, HIGRAD used approximately 118,000 Jaguar processors during three separate simulations.
In addition to enabling advances in mirroring microphysical processes, HIGRAD is the first tool used to build a three-dimensional model of the lightning activity in a hurricane. Data measured from Rita—the fourth most intense Atlantic hurricane on record (Katrina was the sixth)—by LANL’s lightning-detection network, the Los Alamos Spherical Array (LASA), suggest a correlation between the intensification of lightning activity and the intensification rate of the storm.
When lightning strikes it produces electromagnetic waves with high and low frequencies. Ground-based lightning sensors called spy satellites were developed at LANL before Reisner’s team ran simulations of Rita on Jaguar. Originally these sensors could detect only very-low-frequency wave forms, but the team worked to enable them to detect both low- and high-frequency waves, making them the first dual-wavelength sensors for lightning detection.
“Lightning activity is a sort of energy release, especially the lightning that occurs in the eye wall convection,” explained Reisner. “By seeing both frequencies, we’re better able to characterize the actual amount of charge that was discharged during the lightning flash.”
HIGRAD used between 8,000 and 32,000 of Jaguar’s processors to simulate Rita under LASA observations. These simulations continue to suggest that remote monitoring of lightning activity in a hurricane can be used in models not only to predict hurricane intensification rates, but also to better predict a storm’s path and structure.
“Long term what we want to do is use the lightning data, like we used the radar data, to help understand how much energy is being released in a hurricane at a given time. And that hopefully will lead to much better predictions of intensification,” Reisner said.
Data gathered from Hurricane Guillermo in August 1997 by a research team led by Gary Barnes, a professor of atmospheric science at the University of Hawaii, have proved particularly useful to the modeling effort because that hurricane is among the best documented to date. Barnes and colleagues had genuine data from Guillermo thanks to the efforts of “hurricane hunters” at the National Oceanic and Atmospheric Administration. These pilots navigate planes equipped with meteorological equipment into weather systems to collect environmental and geographic data.
“They put their lives at risk by flying around the hurricane’s eye for 6 hours,” Reisner said. “Every half hour they are able to basically come up with a very detailed image of what the convection looks like around the eye.”
Additionally, the Guillermo data set represented the intensification of a hurricane impacted by wind shear. Models typically do not portray intensification rates of sheared storms accurately because of the extremely volatile nature and subtle balance of the multiple forces and processes involved. Simulations of Guillermo are especially useful because the field data are unprecedented in scope. Multiple simulations were conducted to fine-tune models to more closely mirror the myriad of possible development patterns of storms affected by wind shear.
“The Guillermo data set with Jaguar allows us to know that we really need to understand a hurricane in terms of its structure and intensity,” Reisner said. “That in itself is very important because you may be getting the right intensity but the wrong structure. You have to get both because [if you don’t], it shows quickly you have a big error in your model.”
The unexpected
One of the LANL team’s biggest findings was unexpected. While running simulations to express the number of particles involved in several microphysical processes in the eye wall, the researchers discovered that all traditional models are plagued with improper expression of cloud boundaries.
These models structure clouds as single, continuous objects, when in reality they’re made up of individual droplets approximately 4 to 100 micrograms each in weight. Roughly one million cloud droplets are found in a typical raindrop. The scientists found that this structural mischaracterization causes a false rendering of cooling called “spurious evaporation,” which offsets the correct temperature conditions of latent heat in the eye wall and leads to an unrealistic gauge of a key aspect needed to predict hurricane intensities.
“If you can get rid of spurious evaporation, you can get the structure right and the intensity right,” said Reisner, who is incorporating his group’s results into operational hurricane models. —by Wes Wade with reporting from Eric Gedenk and Caitlin Rockett
Related Publications:
Fierro, A.O. and J.M. Reisner. “High-Resolution Simulation of Electrification and Lightning of Hurricane Rita during the Period of Rapid Intensification.” Journal of the Atmospheric Sciences 68 (2011): 477-494.
Godinez, H.C., J.M. Reisner, A.O. Fierro, S.R. Guimond, and J. Kao. “Determining Key Model Parameters of Rapidly Intensifying Hurricane Guillermo (1997) using the Ensemble Kalman Filter.” arXiv.1107.4407v1