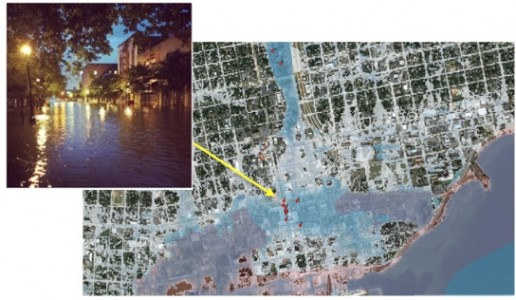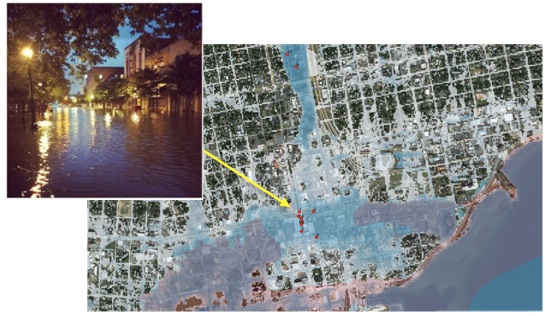
Flooded Pensacola Downtown Area Outside of FEMA Hazard Zones, April 2014
Blue Shading – KatRisk Flood Model
Red Hatched – FEMA Zones A and V
New maps help insurance industry better price risk
No area is immune to the devastation of flooding. Severe storms are a regular and unavoidable part of life, and with them comes the risk that people will lose their livelihoods, their homes, and sometimes their lives.
The risks, of course, extend worldwide. To cite just a few examples, flooding took 25 lives in central Europe in May and June 2013, followed within weeks by an astonishing 5,700 lives in northern India, followed that July by 50 lives in southern China and another 100 in Pakistan and Afghanistan.
The United States is far from immune. The following September, Boulder County, Colorado, received nearly a year’s worth of rain in less than a week, with up to 17 inches falling between September 9 and 15. Eight people died in the Colorado floods, more than 1,500 homes were destroyed, and another 19,000 homes were damaged.
The National Oceanic and Atmospheric Administration tells us that an average of 89 Americans have died in flooding each year over the last three decades, with floods lying behind an average $8.2 billion annually in property damage.
The risk can be reduced
And yet, while storms and flooding can’t be avoided, deaths and property loss sometimes can be. That’s the goal of KatRisk, a small California startup using the Titan supercomputer, located at the Department of Energy’s Oak Ridge National Laboratory (ORNL), to create an unprecedented product: flood risk maps covering the globe.
The company has already produced maps for the United States and Asia, which include risks both from overflowing streams and rivers and from flash floods. In the United States, where high-quality data is more plentiful, the maps are at a higher resolution, down to individual cells of 10 by 10 meters. In Asia, the cells are from 90 by 90 meters down to 30 by 30 meters.
KatRisk began in 2012 as a labor of love for its three founders—Dag Lohmann, Stefan Eppert, and Guy Morrow. The three came to the business with more than three decades’ experience in engineering, hydrology, and risk modeling. But what may be even more impressive is that they’ve been able to move forward entirely with their own resources.
“We’re self-funded,” explained Lohmann. “With low overheads and lots of enthusiasm, this was possible with some consulting on the side.”
Their immediate goal is to create and sell risk maps to the insurance industry. This is where the demand is in risk modeling, as well as much of the expertise. These maps give insurance firms a better understanding of a region’s real flood risks and the ability, therefore, to reflect that risk more accurately in insurance products. As a result, the industry also has the power to drive prudent decision making among homeowners; to put it another way, the decision not to build in a flood zone might be based on the cost of flood insurance, but it could, coincidentally, end up saving lives as well.
“Nobody wants to pay too much for insurance, but everybody should pay close to what the real risk is,” Lohmann said. “If you’re at the beach or if you’re right next to a river, then you should be paying more for your risk because you’re more exposed to it.
“By doing that we will also enable people to have risk-appropriate behavior. If you live close to a river, for instance, then make sure that your house is slightly elevated or moved away from the river, or move your house away from the coast a little bit so that your insurance rates can go down.”
There is a real need for the maps. In the United States, flood maps from the Federal Emergency Management Agency (FEMA) don’t cover the whole the country. And even these maps don’t contain all the information needed to determine a location’s risk. For instance, while they tell you whether you’re in danger of flooding, current FEMA maps mostly don’t say whether the flooding will be an inch, a foot, or 10 feet.
The situation is even worse in most other countries, where it’s often very unclear who is and is not in a flood zone.
To complicate the issue even further, many flooding maps don’t cover all the ways an area can become flooded. While they typically do address the dangers posed by overflowing rivers (known as fluvial or riverine flooding), they often don’t consider the flash flooding associated with heavy rain (known as pluvial flooding). Pluvial flooding may flow into existing rivers, or it may form its own rivers. The dangers associated with it help explain why 20 to 40 percent of US flood claims come from outside FEMA flood zones.
How to create reliable flood maps
To produce flood maps, KatRisk must know both how much rain is likely to fall on any given spot and how that water will then flow and collect.
Global data collection itself was a serious challenge. Even where there is high-quality, long-term rainfall data—and this is not everywhere—the information is typically not free (a particular challenge for a self-funded startup). For many locations KatRisk had to rely on satellite information or readings collected from rain gauges.
The second required input is how water flows in rivers and how flood peaks interact on a regional scale. For that the team needed hydrology models—that is, models of how the water moves through a system—for each area.
“My good fortune was that I worked for the National Weather Service on a similar project,” Lohmann said, “the global and the North American Data Assimilation System, which essentially did exactly that, running hydrology models globally.”
Lohmann noted that the equations embodied within the KatRisk model came from peer-reviewed publications. With them the team is able to run the simulations, taking the most reliable possible rainfall information, applying hydrologic and hydraulic models to show where the water will flow, and eventually determining how deep the water might get at each surface location.
KatRisk commits to GPUs
The calculations are a natural fit for graphics processing units, or GPUs, according to Lohmann. Specifically, he said, GPUs have two major advantages over traditional central processing units, or CPUs.
The first is simply the number of calculations a GPU can perform at once. A CPU, while it handles diverse instructions more gracefully than a GPU, can handle only one thread—or stream of calculations—per core. As a result, a 16-core CPU can execute only 16 threads simultaneously. In contrast, a high-end GPU can handle thousands of threads simultaneously, making it ideal for running through a list of straightforward calculations with lightning speed.
Also important for KatRisk, Lohmann said, is the speed at which information can travel in and out of memory within the GPU, a number known as memory bandwidth. KatRisk’s application needs relatively little communication between nodes (because, for example, a simulation of flooding in the eastern United States does not require information about what’s happening in Asia or Europe), so it can make the most of this fast bandwidth within the GPU.
To get the most out of the GPUs, the company also made a commitment to writing code at a very low level. In other words, their code spells out the fluid mechanics—or hydraulics—manually for each GPU thread rather than asking a compiler to assign duties. In this way, it gets the best possible performance from the accelerators.
Lohmann said the payoff was well worth the effort.
“We started coding up hydraulics on the GPUs,” Lohmann said. “And we saw very quickly that when we went down to the kernel level, we could get performance gains of easily 200 times what a single CPU core could do. Seeing that, we realized the value of it for hydraulic modeling.”
Tapping the power of Titan
The company is so devoted to GPU computing, in fact, that it built a 14-node GPU cluster at its Berkeley headquarters with NVIDIA branded GPUs. That means each GPU is able to deliver just shy of 4 trillion single-float calculations a second, or 4 teraflops, nearly 30 times the peak performance of a neighboring 16-core CPU in Titan.
But as impressive as its work had been, the company knew its 14-node cluster would not produce timely flood maps for the entire world. Recognizing this, KatRisk turned to ORNL’s Oak Ridge Leadership Computing Facility (OLCF), a DOE Office of Science User Facility. The company received a Director’s Discretionary allocation of 5 million processor hours on Titan through the OLCF’s industrial partnership program, known as Accelerating Competitiveness through Computational Excellence.
Titan is the world’s second most powerful supercomputer and boasts 18,688 nodes, each containing an NVIDIA K20X Kepler GPU. The KatRisk team was able to harness as many as 1,500 GPUs at a time and reach performance of 6 thousand trillion calculations a second, or 6 petaflops.
And it was the power of Titan that enabled the team to model the entire planet.
“Using Titan, we reduced 18 month of computation time to 5 months for our US and Asia maps,” Lohmann said. “This allowed us to accelerate our time-to-market for these maps by a full year.”
Next step: probabilistic coupled models
The maps have already been completed for the United States and Asia, Lohmann noted, and maps for the rest of the world should be completed before the end of 2014. The challenge, he said, is analyzing the 10 terabytes of data produced by the Titan runs.
KatRisk is already providing free information on potential losses for hurricanes in the United States and typhoons in Asia through an online tool called “Katalyser.” To use the tool, a homeowner can visit katalyser.com and enter information such as the latitude and longitude of their property.
While KatRisk rainfall-based maps will help the insurance industry distinguish good risk from bad and refine its underwriting, for the future the company is also working to create probabilistic models that detail specific flooding scenarios linked to events such as a hurricane making landfall or a large snow melt after a very cold winter. These models could then inform the user about the risk related to a portfolio of locations.
“So now that we have information about the static flood risk, with flood maps for each location,” Lohmann explained, “we want to couple our inland flood model with a storm surge model driven by tropical cyclone winds to compute all these possible scenarios.
“Think about weather prediction for a second. If somebody tells you there’s a 20 percent chance of rain tomorrow, it basically means that out of the ten computer models, two produced rain and the other eight didn’t. The insurance industry needs something like that, but with 10,000 or 100,000 ensemble members for the next year, because they want to quantify the losses from extremes.”
The Oak Ridge National Laboratory is supported by the Office of Science of the U.S. Department of Energy. The Office of Science is the single largest supporter of basic research in the physical sciences in the United States, and is working to address some of the most pressing challenges of our time. For more information, please visit science.energy.gov


