
Score-P / Vampir Workshop
Score-P / Vampir Workshop (Presented by Ronny Brendel)
Oak Ridge National Laboratory
August 17, 2018
Building 5200, Tennessee A,B
9:00 AM – 4:00 PM
The Oak Ridge Leadership Computing Facility (OLCF) will host a workshop on August 17, 2018 to show users how to profile applications using Score-P and Vampir. These two tools are usually used together; Score-P is used to collect performance data from an application and Vampir is then used to visualize the data.
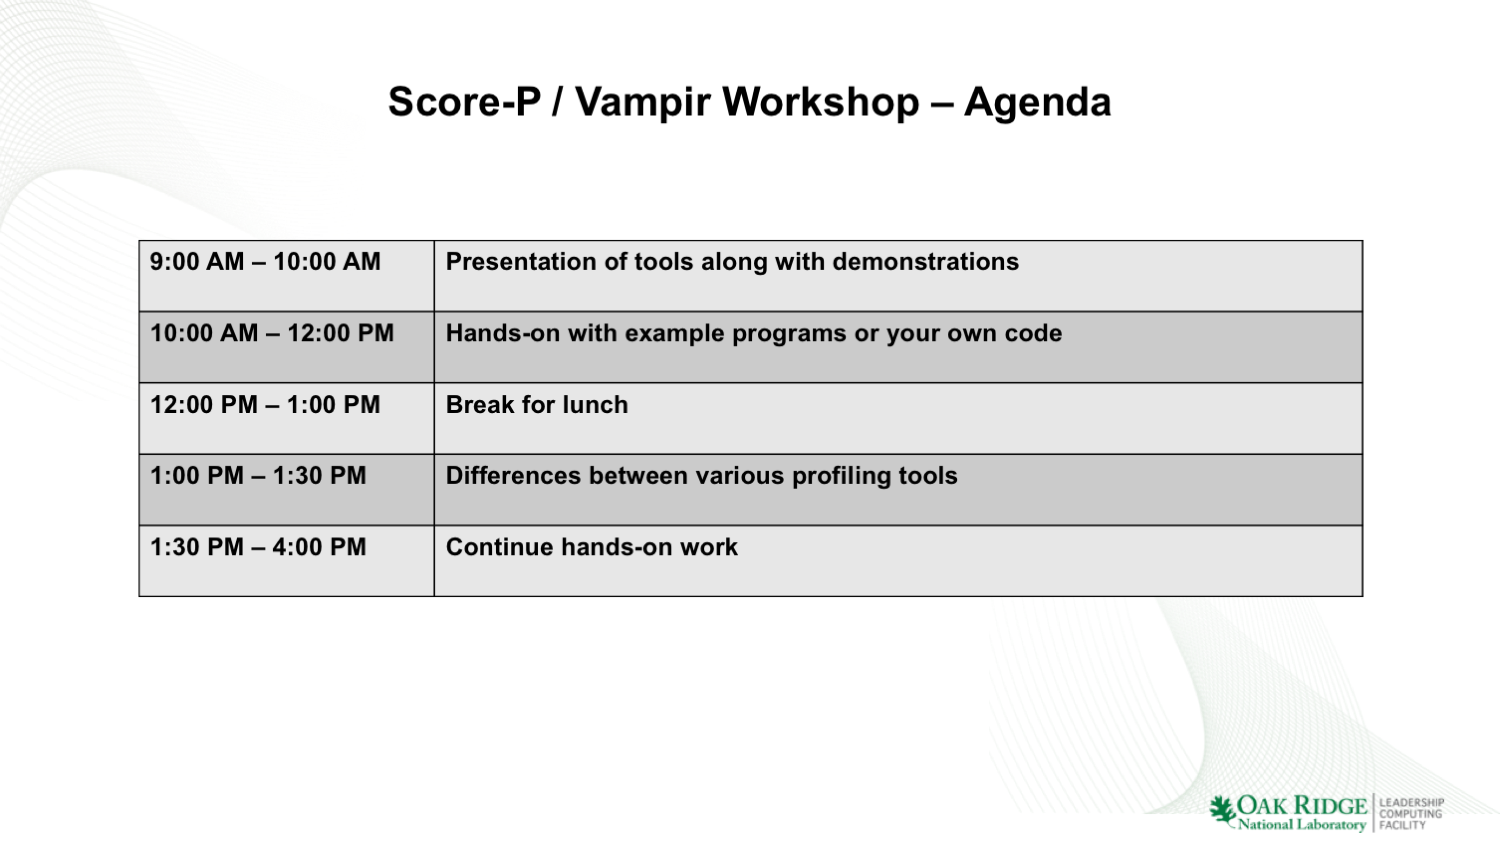
What to Expect During the Event
The workshop will begin with presentations to introduce the Score-P and Vampir tools as well as some demonstrations on using them. Afterward, there will be a hands-on session, where participants will be given an example application to profile.
You can also bring your own application to profile during the hands-on session! However, if you plan to bring your own application, you must be able to compile and run it on Titan or SummitDev before the event. Also, because we have a limited number of mentors available, we will only be accepting a total of 6 to 8 user applications, so please register soon.
Important Registration Deadlines for All Participants Without Current ORNL Badges
If you have any questions, please contact Tom Papatheodore ([email protected]).
[tw-tabs tab1=”Registration” tab2=”Maps, Directions, & Hotels” tab3=”When You Arrive” tab4=”Remote Participation (limited)” tab5=”Agenda” tab6=”Presentations“] [tw-tab] [/tw-tab] [tw-tab]
There are a number of nice hotels in Oak Ridge, TN.
| Hotel | National Number | Local Number |
| Comfort Inn | 800.228.5150 | 865.481.8200 |
| DoubleTree | 800.222.TREE | 865.481.2468 |
| Hampton Inn | 800.HAMPTON | 865.482.7889 |
| Holiday Inn Express & Suites | 800.HOLIDAY | 865.298.1990 |
| Quality Inn | 877.424.6423 | 865.483.6809 |
| Staybridge Suites | 800.225.1237 | 865.298.0050 |
Maps and Directions to ORNL: https://www.ornl.gov/content/maps-and-directions
Map to ORNL Visitor Center: https://www.ornl.gov/sites/default/files/or_area.pdf
Map of Visitor Center and Parking: https://www.ornl.gov/sites/default/files/visitor_map.pdf
[/tw-tab]
[tw-tab]
The event will take place in Building 5200, which conveniently houses the visitor center and cafeteria as well. After entering ORNL, non-badged team members must stop by the visitor center to pick up their temporary badge before heading upstairs to the event.
[/tw-tab]
[tw-tab]
Please NOTE: Remote participation will be limited to the presentations and demonstrations only. The hands-on session will not be broadcast or recorded.
To join the Meeting:
https://bluejeans.com/105607782
To join via Room System:
Video Conferencing System: bjn.vc -or-199.48.152.152
Meeting ID : 105607782
To join via phone :
1) Dial:
+1.408.740.7256 (US (San Jose))
+1.888.240.2560 (US Toll Free)
+1.408.317.9253 (US (Primary, San Jose))
(see all numbers – https://bluejeans.com/numbers)
2) Enter Conference ID : 105607782
[/tw-tab] [tw-tab] Score-P / Vampir Presentation (Ronny Brendel): (slides | recording)
[/tw-tab] [/tw-tabs]